My template writing task 1 and vocabulary for maps and charts
Writing Task 1 of the
IELTS seems complicated because it has many types, like charts, tables,
diagrams, and maps. Therefore, we need a large vocabulary for each type.
However, in my opinion and after watching many tips from teachers, if you have
a template and know the most important vocabulary for each type, you will do
well in Writing Task 1.
So, I will share with
you my template and the vocabulary that I have been memorizing over months of
practicing Writing Task 1. I believe that it will help you improve in Writing
Task 1.
I would like to emphasize that you do not need a large vocabulary. Remember, you will do Writing Task 1 only once, so always practice with the same words that are easy for you to memorize. For example, in the conclusion, I use: to conclude, to sum up, or sometimes I use to finish.
Remember you have 20 minutes for this task and you write at least 150 words.
(there are some exercise for you to practice at the end of the post)
Let's start.
Writing Task 1 Template
Paragraph 1 - Introduction- Start
with: illustrates, shows
- e.g.:
The graph illustrates…
- The map shows…
- Paraphrase
the given sentence to describe the illustration, but include other
relevant information not presented.
- Generally
40-50 words.
Paragraph 2 - Overview- Start
with: Overall
- e.g.:
Overall, coal shows the highest production in France…
- You
can compare categories or elements.
- e.g.:
Overall, handheld games show an increase in sales over the years, along
with growth in sales of online games and mobile phone games. Additionally,
console games show a drop from 2001 to 2006.
- Try
to use complex sentences. In other words, complement the information of
the graph, map, etc.
Paragraph 3 - Main Details- Insert
the most important data.
- Try
to use complex sentences. In other words, complement the information of
the graph, map, etc.
Paragraph 4 - Conclusion- Start
with: to conclude, to sum up, to finish
- Generally
30-40 words.
- Include
other results or provide a summary of the results.
- Try
to use complex sentences. In other words, complement the information of
the graph, map, etc.
Link words are important in the essay. e.g: otherwise, meanwhile, furthermore, moreover…
See my post about linking words: Linking words🠜
Vocabulary Chart
Reach
Roughly
A
peak of
Decline
Drop
Grow/
growth
Hit
a high of
Hit
a low of
Provide
Reach
a peak of
Unchanged
Trend
Average
Less
than
Under
Will
over
Stable
Increasingly closer
Downward
trend
Ratio
Upshot
Slight rise
Vocabulary map
North/south/west
east northwest southeast southwest
Heading
east
Near
In
front of
By
the side of
Next/by
Between
Facing
In
the middle
Right/left-hand
side
Beside
Leads
of/to
Located
The
central
At
the center
For more map vocabulary you can watch these videos will help you: https://www.youtube.com/watch?v=amaisZG6bQI
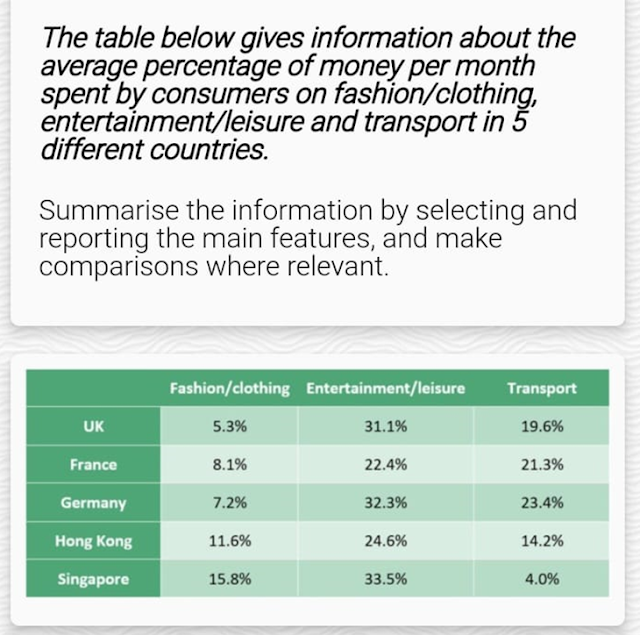
Chart Excercises:


.gif)


Comments
Post a Comment